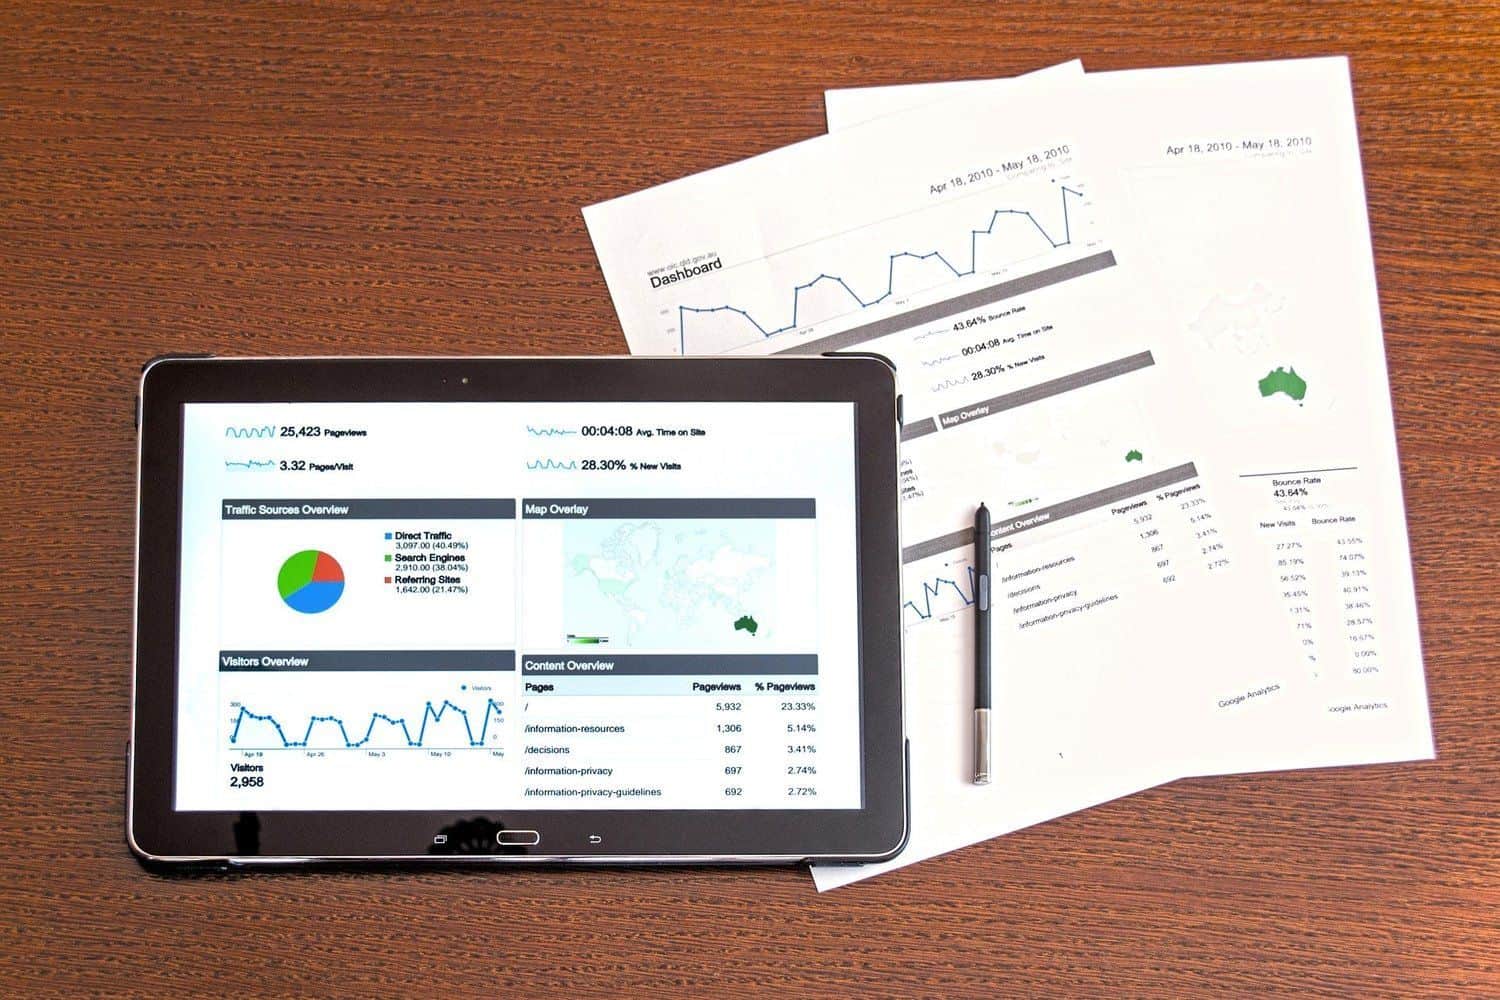
The rate at which we generate and store data isn’t slowing down any time soon. But is all data good? The short answer is no. With the proliferation of devices generating data, there is a lot of noise that is collected. That is exactly why you need Business Intelligence (BI).
What is Business Intelligence (BI)?
BI is the science of analyzing data sets (of varying size and structure). Analyzing the data intelligently helps separate the quality data from the unnecessary. An important aspect of BI is reducing the noise and pulling out nuggets of wisdom. Sure, everyone likes nuggets…but how do you get there? There are many tools available on the market to join data, create data warehouses and present this information in a visually pleasing way.
What should we use for BI?
One of my favorite dashboarding tools is Microsoft PowerBI. PowerBI is a low-cost entry into the big field of business intelligence dashboarding. Microsoft is constantly pushing out new features to PowerBI. Features like new visuals, better tools for complex queries or better ways to manage audiences. PowerBI also has a very active community online. Power BI is currently available as part of the Office 365 Enterprise E5 version.
Benefits of PowerBI
PowerBI allows you to connect a multitude of data sources to the web, securely. Now you can share that awesome sales dashboard easily in just a few clicks! It no longer matters if your database is SQL, Oracle, Microsoft Access or Excel. It also doesn’t matter if your data is on premise, in the cloud or on a file share. PowerBI can communicate with these and many other sources.
Along with seeing the dashboard in the web, there’s a free app you can download from the app store. The app has features like annotating a screen shot of a dashboard to email along to the team and being able to slice through your production numbers as they happen.
What can BI do for your industry?
If you are in the manufacturing industry, wouldn’t it be great to see the not only order history – but orders that are waiting to be fulfilled? Also, business intelligence and PowerBI would be a great tool to visualize cashflow projections, in any vertical. Seeing where you have been and knowing what is coming will better allow you to properly plan your operations, no matter what your business is.
To open an app and receive a real time dashboard of how your business is performing, is truly powerful.
