I frequently help out clients with data reporting. Usually I’m not called in unless the challenge is fairly complex, often involving multiple tables, many times across databases, and not infrequently cross-platform (i.e. Oracle and SQL Server,) but after years of working with SQL, cranking out views and the supporting functions, stored procedures, and Extract-Transform-Loads comes as natural as throwing a Frisbee. While I may occasionally toss one on the roof (where all Frisbees go to die,) the reports usually come in to balance pretty quickly, and by staying with simple clean fonts and the judicious use of white space my reports usually are presentable on the first pass.
The real fun for me begins when my clients start to analyze their newly minted reports. A typical response is “this report must be wrong, it doesn’t match with what we were getting off the old xyz system”. Experience tells me that even when I’m confident in my coding, keeping an open mind and working with the client quickly resolves the discrepancies. I can’t count the number of times I’ve proven that that old xyz system wasn’t producing the “correct” results. The root cause of the flaws in the old system is occasionally bugs, but more often just a misunderstanding of data terms, filtering values. Users made assumptions that turned out to be incorrect, i.e.: “You mean Texas is not in the Northwest region?” or “I thought we were using the Invoice Date, not the Sales Date.”
While producing quality reports is rewarding to me, helping clients get better insights into their is business the most fulfilling part of the process. Business Intelligence is more than producing accurate and easy to digest reports.
The following is a great example of the “missing data” that is the real key to understanding a difficult and deadly real work problem, adapted from How Not to Be Wrong: The Power of Mathematical Thinking by Jordan Ellenberg.
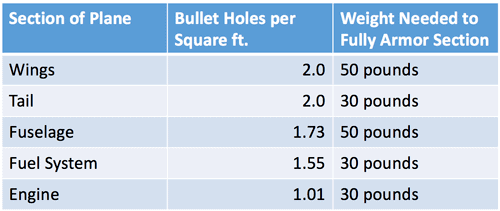
British and American airplanes were getting shot down at a terrible rate at the beginning of World War II. Allied Intelligence did an extensive study of airplanes returning from their missions. This is what their aeronautical engineers found:

Every pound of armor took a toll on the airplane’s fuel efficiency, speed, and maneuverability. The knee-jerk reaction from the flight chief mechanics was to armor the wings and tails…after all, they seemed to be getting hit most frequently.
Fortunately for the Allied pilots, the brilliant mathematician Abraham Wald was brought in to analyze the data. His insight: the data only shows hits on airplanes that returned to base safely. By assuming hits were more or less random, the “missing hits” are the ones that shot down airplanes. His quick fix to armor the engines and fuel system paid immediate benefits to the Allied pilots.
I always caution clients that their reports are only part of the picture. A favorite example I like to provide is looking at historically lagging sales data for a region: Are shoe sales on the tropical island bad because the population is has no demand for shoes, or have we just done a bad job trying to sell Oxford Loafers when we should have been selling Crocs?!